Tag Archives: lightpollution

Analysing CCD characteristics and Determining minimum optimal exposure time.

Motivation

My main interest st the moment is in minor planet astrometry, particularly of brighter Near Earth Asteroids. In order to get precise astrometry of these objects it helps if they are not moving in a single frame. Slow NEO’s can have rates of several arcseconds per minute so being able to take short exposures and stacking them is often required to get precise enough astrometry. It is possible to compute the minimum exposure needed for an asteroid by ensuring it’s movement does not exceed the FWHM of stars in your image, e.g. if an NEO is travelling at 4”/minute and you have a FWHM of 4” then an image one minute in duration will not show trailing. However it is also necessary to understand what the minimum exposure you can take with your setup is to minimise noise and maximise the signal to noise ratio. And it was necessary to understand the camera characteristics in order to make that determination. Continue reading Analysing CCD characteristics and Determining minimum optimal exposure time.

Light Pollution – Perhaps the SQM-LU isn’t the best choice for a mobile setup!

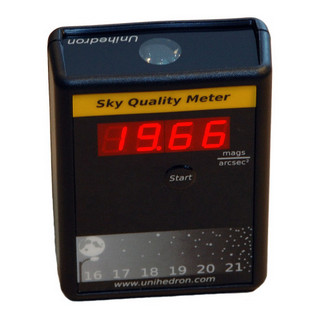
I was considering getting the SQM-LU, the USB lensed SQM meter, for using as a mobile dark sky setup. This would be very similar to my previous attempt where I used a GPS and the IYA lightmeter around Wicklow.

There are a few issues with using the SQM-LU in this way.

Continue reading Light Pollution – Perhaps the SQM-LU isn’t the best choice for a mobile setup!

Advice on graphing tool (like rrdtool but for more & different data) ?

I have some data that I need to come up with a way to graph. I’m using the Light Pollution from Thüringer Landessternwarte, Tautenburg, Germany and our friends at Kuffner-Observatory, Vienna, Austria. I have this unit hooked up to take a reading every second. It records the temperature, and data from three light meters, one designed to capture low levels of light which is of interest to us for light pollution (plotted logarithmically below). Anyway the units for these are all different and I cant see a way to plot them all on the same graph with rrdtool. In practice I probably don’t want to plot them all, but I do want to overlay mathematical models on the graphs. For example to plot the altitude of the sun and/or moon altitude and phase on the graph to see how that correlates to the light meters.

So any suggestions on what I can use to create these? Data is in a mysql database; need to be able to script the graph generation also.

By the way Dalkey got down to -6.3C during December, and snow on the ground does seem to cause an increase in light pollution. It’ll be interesting to compare some of this against an identical sensor on the top of the physics building in Trinity and if we can get it, air pollution data for the month. Basically we’d expect the increased albedo to increase light pollution, but snow has a reputation of clearing particles form the atmosphere so perhaps with less particles the light pollution is somewhat reduced. Lots of questions to answer 🙂

Heres the basic data for most of December to give you an idea at what I’m lookng to merge: